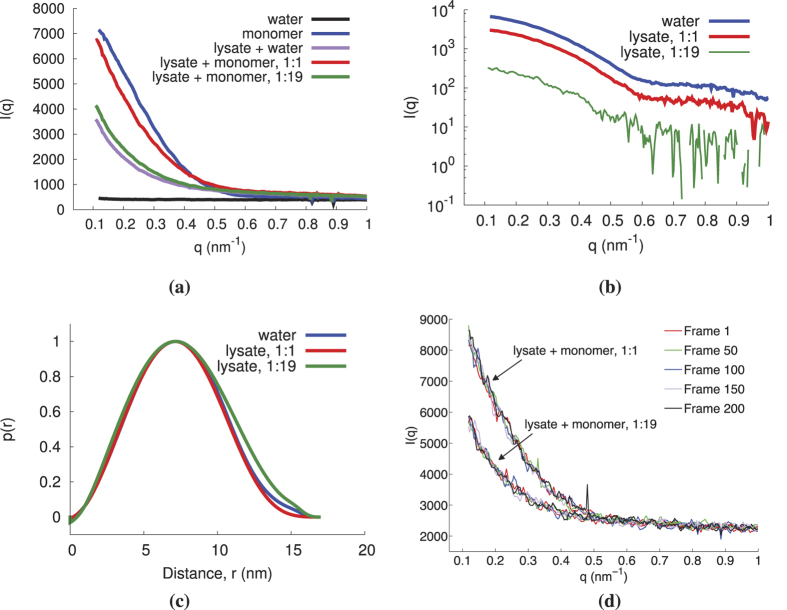
Figure 6. The scattering signal of monomers in cell lysate and water backgrounds were compared, where the monomer in lysate was tested for two dilutions, 1:1 and 1:19.
(a) The dark-subtracted scattering intensity of monomers and their respective background. (b) The subtracted scatter curves of the monomers in water and lysate. (c) The p(r) of monomers in water and lysate. The monomers in lysate and water show good agreement. Only slight deviations in p(r) are seen for the low concentration monomer (1:19) in lysate. (d) Scatter curves (not background subtracted) for different frames (frames 1, 50, 100, 150, and 200) throughout the exposure time. No trend is observed with increasing frame, suggesting no significant damages have occured to the sample.

