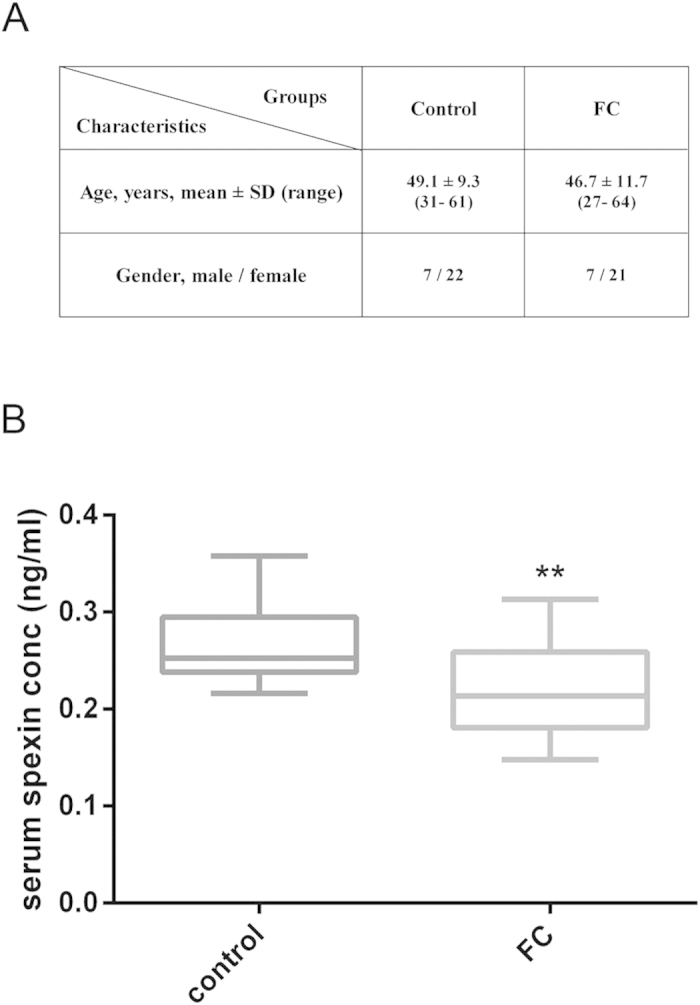
Figure 1. Serum spexin levels in FC patients.

(A) Characteristics of FC patients and control groups. The diagnosis of FC was based on the Rome III criteria. (B) Changes of serum spexin levels in FC patients. Control group n = 31, FC group n = 29. Data are expressed as means ± SEM, Statistical differences between individual groups were evaluated using Student’s t test. **P < 0.01 compared to control group.
