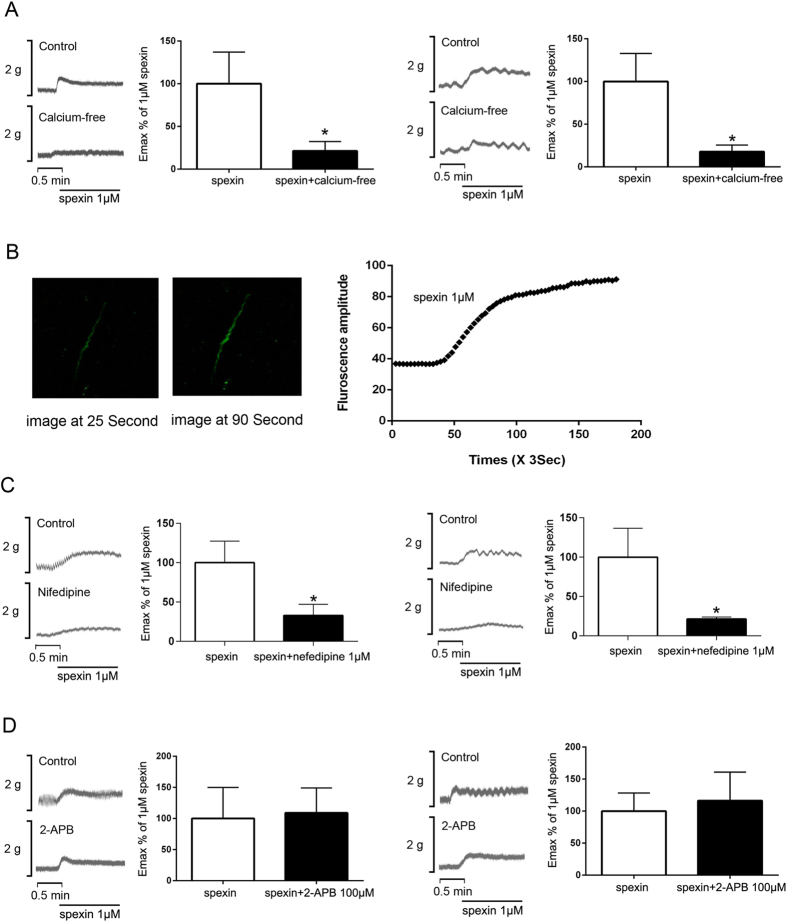
Figure 5. Effects of Ca2+ influx and release on spexin-induced intestinal and colonic motility.
(A) The jejunum and colon tissues were allowed to equilibrate for 1 hour and then the nutrition buffers were replaced with Ca2+ free buffer supplemented with 1mM EGTA. 30 minutes later, the tissues were treated with spexin (1 μM) and the mechanical activities were recorded using the POWERLAB system and CHART5 software. The Emax% of 1 μM spexin in jejunum and colon were calculated. Statistical differences between individual groups were evaluated using Student’s t test. **P < 0.01compared with paired saline-treated controls. (B) Primary colonic smooth muscle cells were isolated, preloaded with the Ca2+-sensitive dye Fura-4 and challenged with 1 μM spexin. The fluorescence amplitude of Ca2+ signal was recorded. Further, The jejunum and colon tissues were allowed to equilibrate for 1 hour and then treated with L type-VSCC inhibitor nifedipine (1 μM, C) and IP3 receptor inhibitor 2-APB (100 μM, D). Thirty minutes later, the tissues were treated with spexin (1 μM) and the mechanical activities were recorded using the POWERLAB system and CHART5 software. The Emax% of 1 μM spexin in jejunum and colon were calculated. Statistical differences between individual groups were evaluated using Student’s t test. **P < 0.01compared with paired saline-treated controls.

