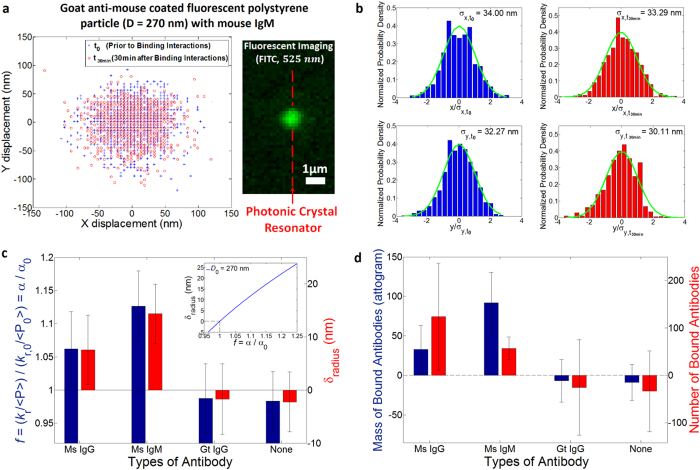
Figure 4. Binding of antibodies to goat anti-mouse IgG coated on the surface of fluorescent polystyrene particle (Dmean = 277.3 nm, σ = 36.2 nm).
(a) Tracking trajectories within the optical trap before (blue crosses) and after (red circles) the binding with mouse IgM. The image on the right side captured by a CCD camera with a FITC cube shows a IgG-coated colloid trapped at the resonator cavity. (b) Normalized probability density histograms of x (top) and y (bottom) displacements before (left, blue bars, kr,t0 = 3.683 × 10⁻³ pN/nm, and kr,t0/ < P0 > = 1.723 pN/nm∙W, ε = 1.44) and after (right, red bars, kr,t1/ < P1 > = 1.851 pN/nm∙W, ε = 1.667 where the eccentricity of the optical trap40 is defined as ε = [ky2 − kx2/ky2]1/2 when ky > kx to quantify trapping force uniformity) binding with mouse IgM. Green curves are Gaussian fits to the histograms. Note that < PTE > is normalizing power to account for a TE mode of field coupled in the resonator cavity that involves in a radial optical trap in x-y plane. (c) Measured relative power-normalized trap stiffness and radius increases for different solutions of mouse IgG (N = 3), mouse IgM (N = 4), and goat IgG (N = 3), and a buffer (N = 5). N represents a number of independently performed experiments. The inset exhibits an analytical plot of the radius change to the relative polarizability for a IgG-coated colloid with D0 = 270 nm. (d) Stoichiometries of the antibodies to the colloid. All error bars are determined by (∑σf2)1/2/N (see SI for details on σf, standard deviation of an independent experiment).

