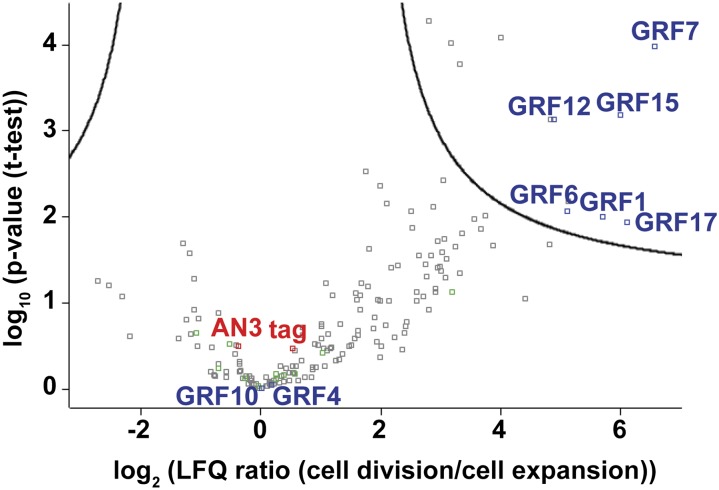
Figure 2.
Relative Intensity-Based Label-Free Quantification in Maize Leaf: AN3/GIF1 TAP Copurified Proteins from Division Zone (1st cm) Compared with Expansion Zone (4th cm).
Significantly changing interactors of AN3/GIF1 are identified by a permutation-based FDR-corrected t test (threshold FDR = 0.01 and S0 = 0.9; Supplemental Table 4). The difference in average log2 LFQ intensities between division zone (group 1) and expansion zone (group 2) is plotted versus the significance (–log10 [P value]). The curve indicates the permutation-based FDR threshold. Positions of AN3/GIF1 bait, tag, GRFs, and core subunits (in green) are marked on the plot.

