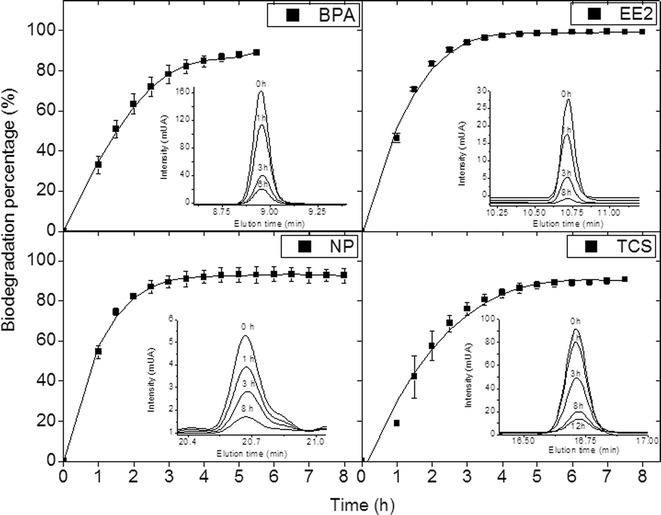
Fig. 3.

Biodegradation profile of 10 mgL−1 synthetic samples for BPA, EE2, NP and TCS by using 100 U L−1 laccase cocktail at pH 5 and 25 °C. Each graph presents the maximum areas of peak taken from the respective chromatograms at different times of enzymatic treatment
