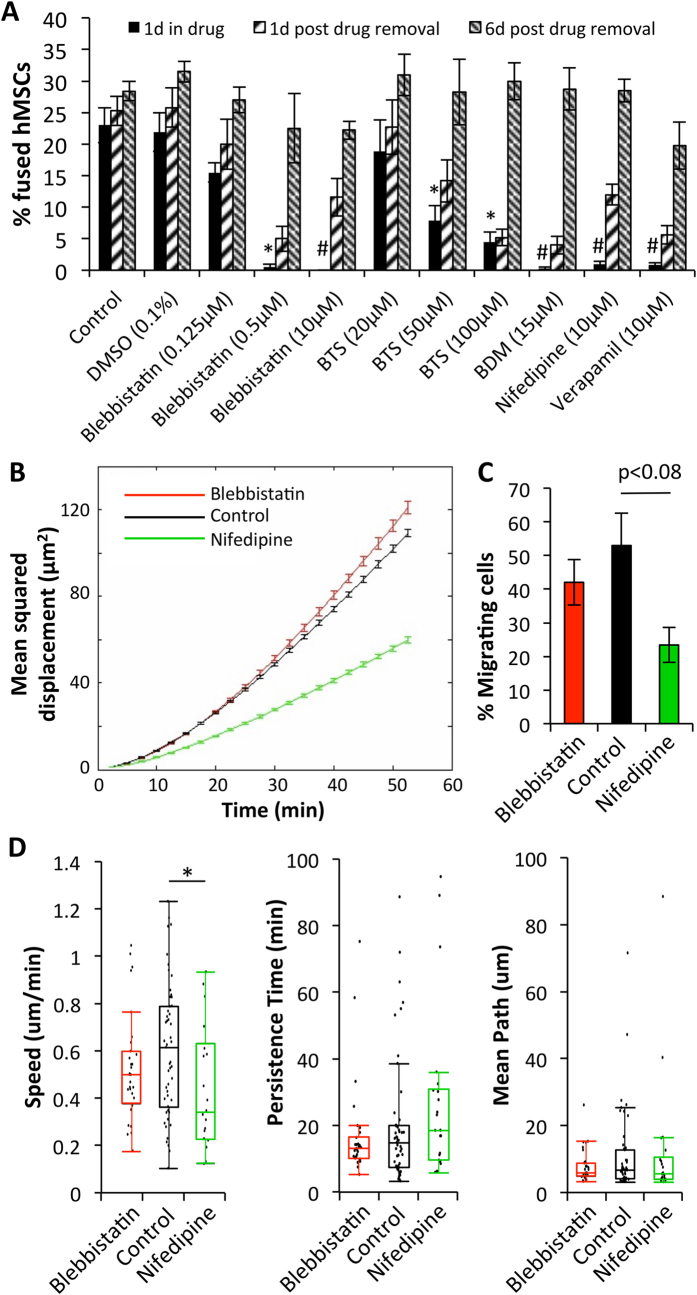
Figure 7. Reversible inhibition of fusion via Myosin II and Ca2+ channel blockade.
A) Fraction of fused hMSCs in 1, 2, and 7-day co-cultures after application of various drugs. Drugs were added at the start of co-culture and removed after 1 day; n = 3–15 co-cultures; *p < 0.01, #p < 0.0001 relative to “Control, 1d in drug”, ANOVA with Tukey’s post-hoc test. (B) Mean squared displacement of hMSCs in co-culture with NRVMs during a 3.5 hr time-lapse imaging in the presence of various drugs. (C) Fraction of migrating cells across all co-cultures. (D) Parameter fitting from individual cells for speed, persistence time and mean path of migration; *p < 0.05. (B–D) n = 2–3 co-cultures, N = 25–54 cells per timelapse of co-culture.

