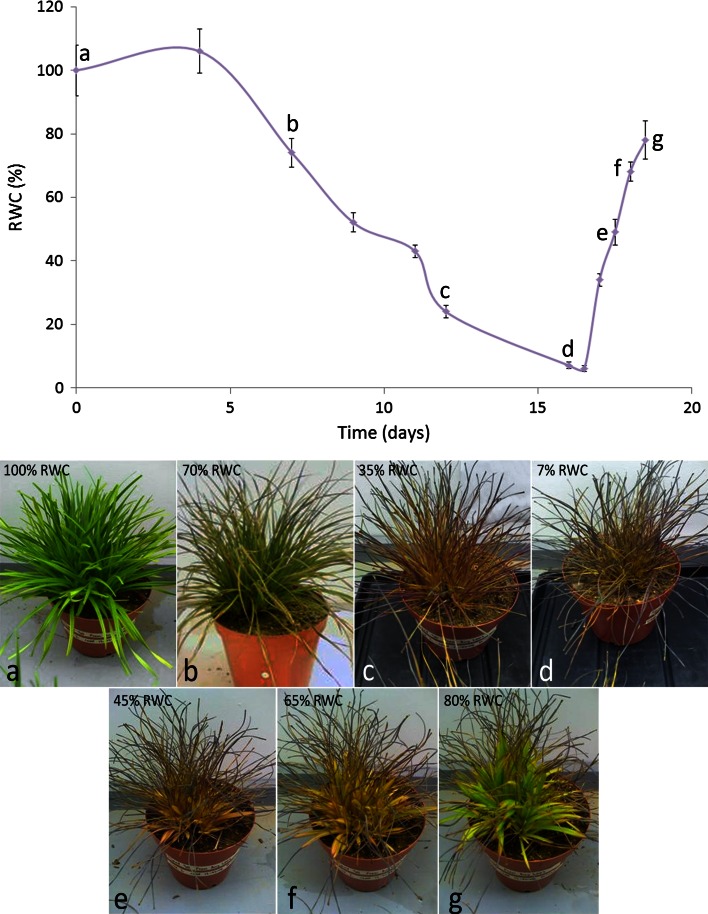
Fig. 4.
Changes in leaf RWC with images of Xerophyta viscosa plants during dehydration (a–f) and rehydration (e–g) under a 16 h light, 350 μmol m−2 s−1, 25 °C and 8 h dark, 20 °C, regime. a Fully hydrated plant (100 % RWC). b 70 % RWC. c 35 % RWC. d 7 % RWC. e 45 % RWC. f 65 % RWC. g 80 % RWC. Absolute water contents were determined gravimetrically as described in van der Willigen et al. (2001) with RWC being calculated from this and the mean water content of tissues at full turgor. All the images are of the same plant except image (b) which is a plant of similar size and age under the same stress treatment in the same growth room

