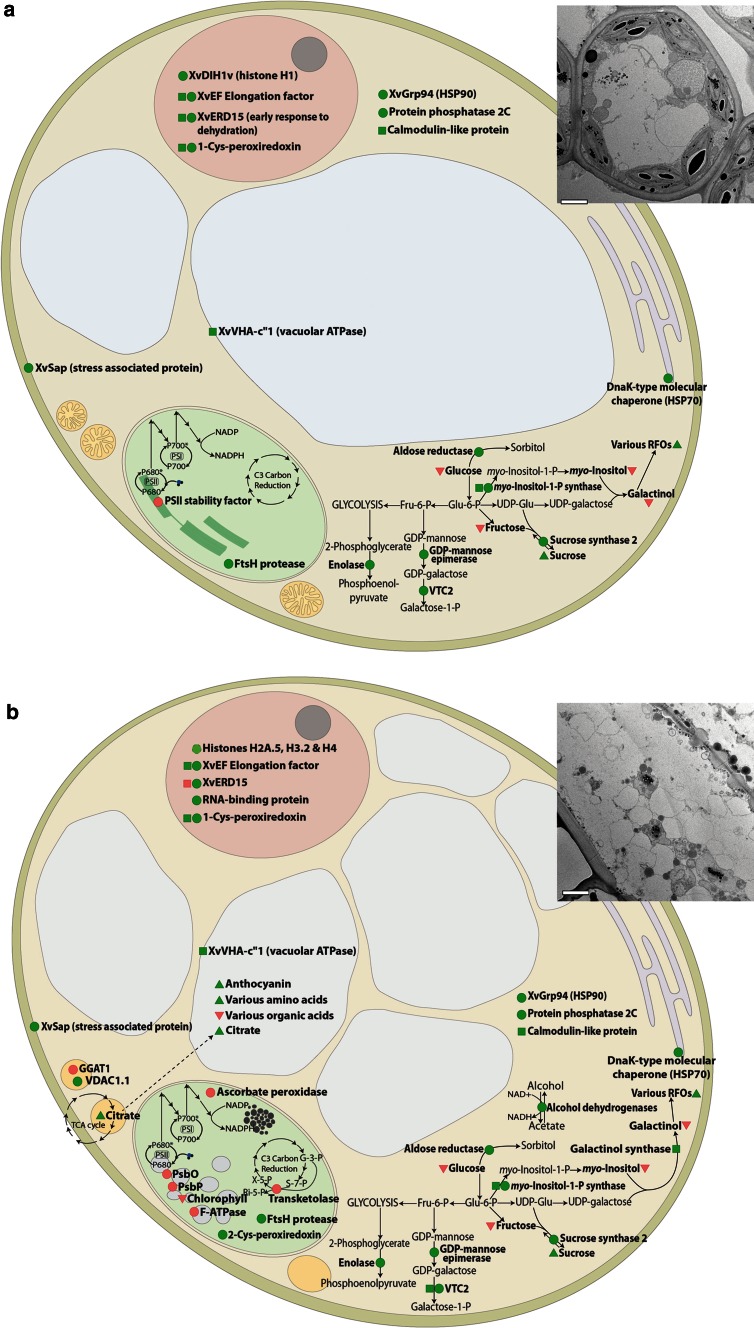
Fig. 5.
Diagram of changes occurring in cells in early stage dehydration (a) and late stage dehydration (a) showing the probable locations of these changes. Green symbols indicate upregulation and red symbols show down-regulation. Proteins are represented by circles, transcripts by squares and metabolites by triangles. Insets show transmission electron micrographs at approximately 65 % (a) and 37 % (b) RWC. Scale bar represents 2 µm

