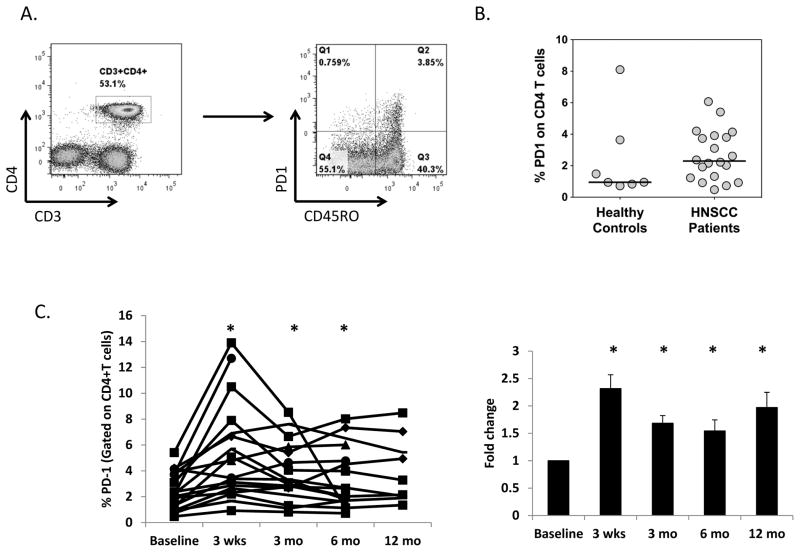
FIGURE 5. Effect of chemoradiotherapy on PD-1 expression on CD4+ T cells.
A. Representative FACS plots showing gating scheme of PD-1 and CD45RO expression on CD4+ T cells, gated on all live cells. B. Expression of PD-1 on CD4+ T cells from healthy control donors (N=7) and HPVOPC patients (N=19). C. Percent PD-1+ expressing CD4+ T cells for individual patients (left) and aggregated -fold change with respect to baseline (right). * = p<0.05 with respect to baseline.

