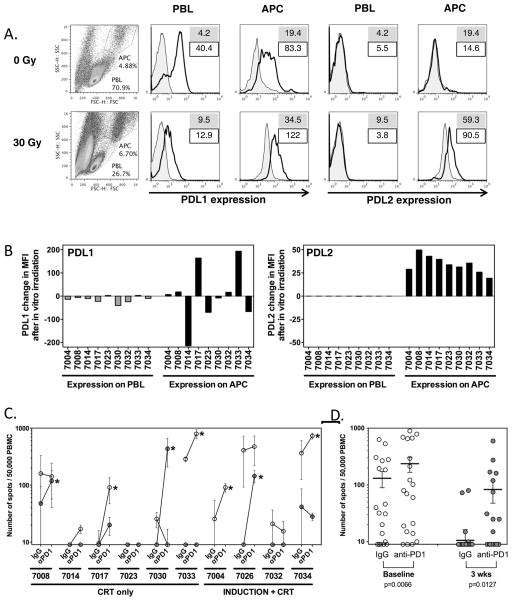
FIGURE 6. Modulation of PD1 ligand expression and effect of PD1 blockade. A–B. Effect of ex-vivo irradiation on PD-L1 and PD-L2 levels on patient PBMC.
A. Representative flow cytometry of PBMC for PD-L1 and PD-L2. Cells were gated independently for lymphocytes and APC based on forward and side scatter. Numbers on histogram plots indicate MFI of isotype control (filled) and PD-L1/PD-L2 mAb (line), respectively. B. Changes in PD-L1 and PD-L2 expression on lymphocytes (PBL) and antigen-presenting cells (APC) from PBMC of patients following in vitro irradiation. The changes in mean fluorescence intensity (MFI) were calculated based on MFI of PDL1 and PDL2 by flow cytometry after subtraction of MFI from respective isotype control, and results were expressed as the differences of these control-adjusted MFI levels before and after in vitro irradiation. Gating of lymphocytes and monocytic/granulocytic populations as above. While radiation increased the overall number of dead cells, viability of PBMC in the APC and PBL gates was >90%. Decrease in PDL1 on PBL and increase in PDL2 on APC after in vitro irradiation were found significant by paired Wilcoxon t test (p=0.0185 and <0.0001 respectively). C. Effect of PD1 blockade on HPV-specific T cell responses. HPV-specific T cell responses measured by ELISPOT in ten patients at baseline and 3 weeks after treatment, in the presence or absence of PD1 blockade. PBMC from individual time points were sensitized with a pool of overlapping long peptides from HPV E6 and E7, cultured in the presence of anti-PD1 mAb or control IgG for 11 days, and assayed for reactivity against the same HPV peptide pool by ELISPOT. Spot numbers indicate HPV-specific IFN-γ secreting T cells out of 50,000 cells tested, following removal of non-specific responses (DMSO control, typically <20 spots). Open and grey symbols indicate responses from samples at baseline and 3 weeks after treatment, respectively. Asterisks indicate samples with a greater than 2x increase in response following PD1 blockade. D. Dot plots showing mean (bar), and standard error of individual replicates from samples of all patients cultured with IgG vs anti-PD1. There were significantly more spots following PD1 blockade both at baseline and 3 weeks after treatment, as shown by paired Wilcoxon t test (p=0.0066 and 0.0127 respectively).

