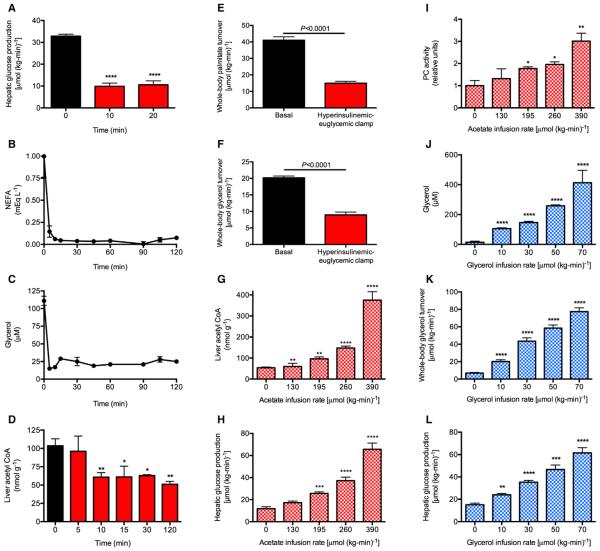
Figure 1. Rapid Suppression of Hepatic Glucose Production Rates Is Temporally Associated with a Parallel Rapid Suppression of Lipolysis.
(A) Hepatic glucose production measured by the Steele equation (Steele, 1959). Comparisons by ANOVA with Bonferroni’s multiple comparisons test. ****p < 0.0001 versus time 0.
(B and C) Plasma non-esterified fatty acid (NEFA) and glycerol concentrations during the hyperinsulinemic-euglycemic clamp. In (A)–(C), n = 6 per time point.
(D) Hepatic acetyl CoA concentrations. n = 4 per time point. *p < 0.01, **p < 0.01 versus time 0 by the two-tailed unpaired Student’s t test. (E and F) Whole-body palmitate and glycerol turnover rates.
(G–I) Liver acetyl CoA concentrations, hepatic glucose production, and pyruvate carboxylase activity in rats undergoing a hyperinsulinemic-euglycemic clamp with co-infusion of acetate. In (G)–(L), n = 4 per group.
(J–L) Plasma glycerol concentrations, whole-body glycerol turnover, and hepatic glucose production in rats undergoing a hyperinsulinemic-euglycemic clamp with co-infusion of glycerol.
In (G)–(L), n = 4 per group. *p < 0.05, **p < 0.01, ***p < 0.001, ****p < 0.0001 versus 0 μmol/(kg-min). In all panels, data are mean ± SEM. See also Figure S1.

