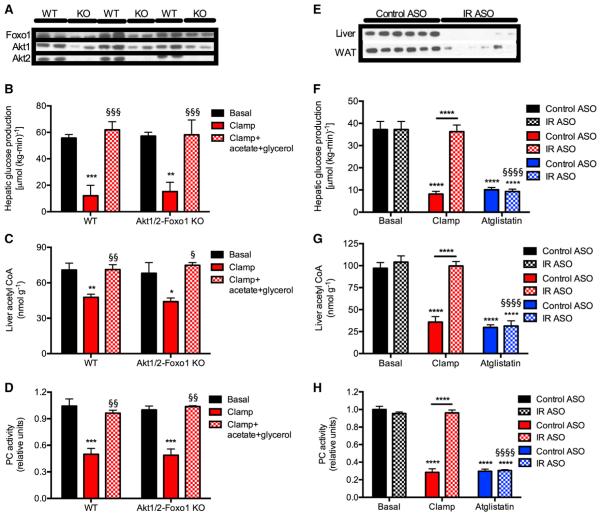
Figure 3. Suppression of Lipolysis Results in Decreased Hepatic Acetyl CoA Concentrations and Suppression of Hepatic Glucose Production Independent of Hepatic Insulin Signaling.
(A) Protein expression in Akt1 and 2 and Foxo1 knockout mice.
(B) Hepatic glucose production. In all panels, black bars, basal; white bars, clamp; and gray bars, clamp+acetate+glycerol.
(C) Hepatic acetyl CoA concentrations.
(D) Hepatic pyruvate carboxylase activity. In (B)–(D), *p < 0.05, **p < 0.01, ***p < 0.001 versus basal, §p < 0.05, §§p < 0.01, §§§p < 0.001 versus hyperinsulinemic-euglycemic clamp by ANOVA. Data are mean ± SEM of n = 5 per group (basal), 8–9 per group (hyperinsulinemic-euglycemic clamp), and 3–4 per group (hyperinsulinemic-euglycemic clamp + acetate + glycerol).
(E) Protein expression in insulin receptor knockdown rats.
(F) Hepatic glucose production. Atglistatin-treated rats were given 600 μmol/kg.
(G) Liver acetyl CoA.
(H) Hepatic PC activity.
In (F)–(H), ****p < 0.0001 versus basal, §§§§p < 0.0001 versus hyperinsulinemic-euglycemic clamp by ANOVA. Data are mean ± SEM of n = 6 per group. See also Figure S3.

