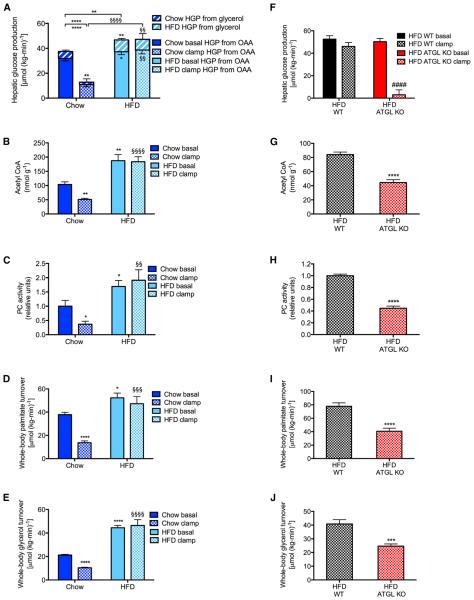
Figure 4. Four Weeks of High-Fat Feeding Increases Hepatic Glucose Production as a Result of Increased Lipolysis.
(A) Hepatic glucose production from oxaloacetate and glycerol. (B and C) Liver acetyl CoA and PC activity.
(D and E) Whole-body palmitate and glycerol turnover.
In (A)–(E), data are mean ± SEM of n = 6 per group. *p < 0.05, **p < 0.01, ****p < 0.0001 versus chow-fed, basal rats by the two-tailed unpaired Student’s t test.
(F) Hepatic glucose production in basal and clamped high-fat-fed adipose-specific ATGL knockout mice. (G and H) Liver acetyl CoA and PC activity.
(I and J) Whole-body palmitate and glycerol turnover.
In (F)–(J), data are mean ± SEM of n = 8 per group. ***p < 0.001, ****p < 0.0001 versus basal WT, ####p < 0.0001 versus basal ATGL knockouts by the two-tailed unpaired Student’s t test. See also Figures S4 and S5.

