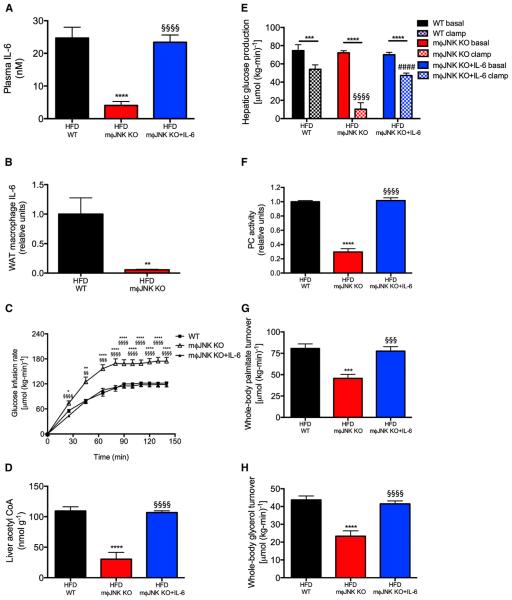
Figure 6. Mice Lacking JNK in Macrophages Are Protected from Diet-Induced Hepatic Insulin Resistance.
(A and B) Plasma and WAT macrophage IL-6 concentrations.
(C) Glucose infusion rate to maintain euglycemia during a hyperinsulinemic-euglycemic clamp.
(D) Liver acetyl CoA concentrations.
(E) Hepatic glucose production.
(F) Liver PC activity.
(G and H) Whole-body palmitate and glycerol turnover.
**p < 0.01, ***p < 0.001, ****p < 0.0001 versus basal mice; §p < 0.05, §§§p < 0.001, §§§§p < 0.0001 versus wild-type, clamped mice. Data are mean ± SEM of n = 10 (WT), 8 (m§JNK KO), or 10 (m§JNK KO+IL-6) per group. The groups were compared by ANOVA with Bonferroni’s multiple comparisons test. See also Figure S7.

