
Fig. 2.
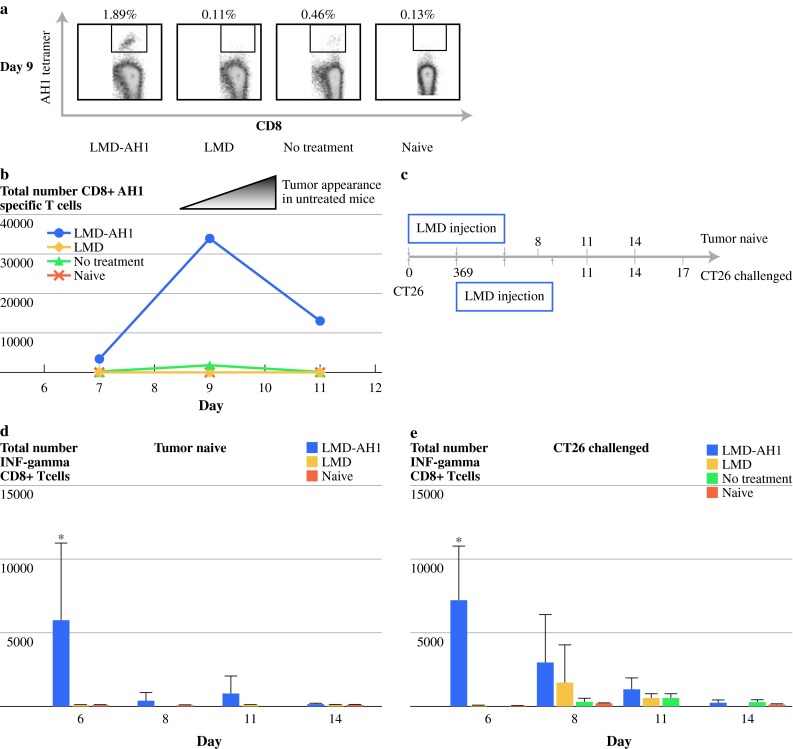
Mice treated with LMD-AH1 have a high number and sustained population of antigen-specific CD8+ T cells with interferon-γ activity. a Percentage of AH1-specific CD8+ T cells on day 9 in the liver; n = 3 mice pooled per group. b Total number of AH1-specific CD8+ T cells on days 7, 9, and 11. c Diagram of Listeria injection schedule of tumor-naive mice compared with CT26-challenged mice. d Total number of CD8+ T cells collected from the liver from tumor-naive or CT26-challenged mice with intracellular staining for interferon-γ after AH1 peptide stimulation, n = 3 mice per group. Two-way ANOVA Bonferroni posttest. *P < 0.001 LMD-AH1 vs. LMD and naive for day 6 for tumor-naive mice. Two-way ANOVA Bonferroni posttest *P < 0.001 LMD-AH1 versus LMD, NT and naive for day 9 for CT26-challenged mice. P = NS unless otherwise noted above