
Fig. 1.
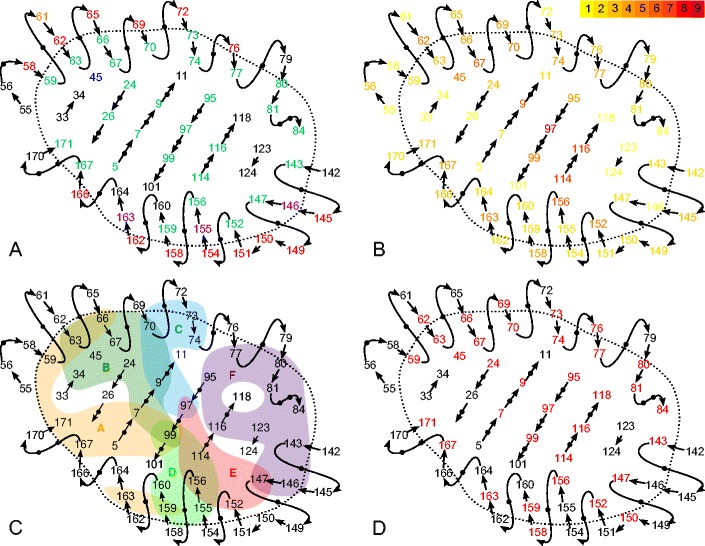
A schematic overview of the binding groove (Adapted from Garrett et al 1989. Nature, Macmillan Publishers Ltd., copyright 1989). The straight lines in the center indicate the platform of β strands, the upper helix is the α1 helix, and the lower one is the α2 helix. Panel a shows which residues can influence peptide binding and T cell recognition according to Bjorkman et al. (1987). Residues pointing toward the peptide binding site and can interact with the peptide are colored in green. Those pointing up from the peptide binding site and can interact with the T cell receptor are colored in red. Residues 146, 155, and 163 are pointing both up and into the binding site (purple). Residue 61 points away from the binding site (orange), and residue 45 is located behind the α1 helix, pointing toward it (blue). The remaining residues are shown in black. Panel b shows the polymorphism of every position on the α1 and α2 domains. The number of different amino acids in our HLA subset (n = 251; see “Materials and methods”) found at a single position is indicated in the colored bar, numbers are colored accordingly. Panel c shows pockets A–F as defined in HLA-A2 (Saper et al. 1991). The positions in red in panel d are used as input for the in silico predictor NetMHCpan