
Fig. 3.
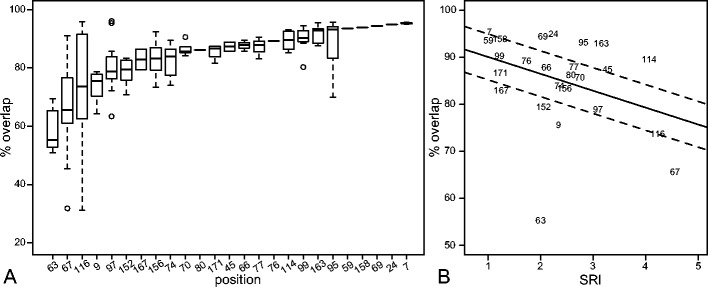
Substitutions in different positions affect the peptide binding differently. Panel a shows the percentage of overlap between the peptide-binding repertoires of two HLA molecules that differ at a single position in the peptide-binding groove. The positions are ordered according to the median overlap within all pairs of HLA molecules. Panel b shows the correlation between the median overlap of all pairs of HLA molecules differing at a particular position and the SRI of that position. The black line represents the linear regression, and the dashed lines represent the standard error. (Spearman correlation, ρ = −0.38, p = 0.06)