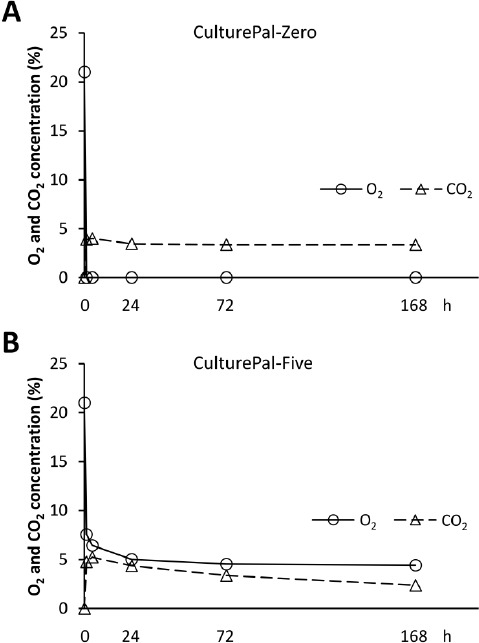
Figure 2.

Changes in the O2 and CO2 concentrations in the hypoxial culture jar. Changes in O2 and CO2 concentrations in the (A) CulturePal-Zero and (B) Culture-Pal-Five hypoxial culture systems. Circles represent O2 concentration; triangles represent CO2 concentration. Values are presented as mean of four independent experiments.
