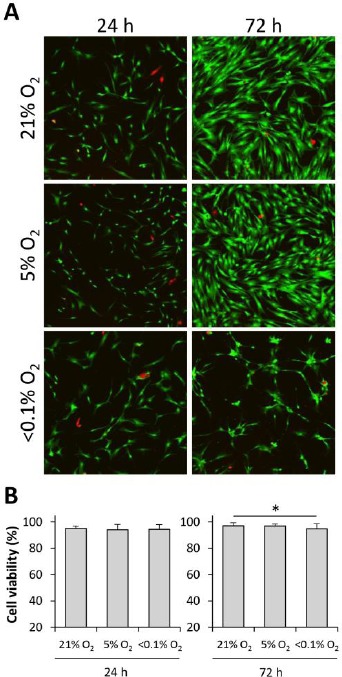
Figure 5.

Cell viability at different O2 concentrations (A) Representative images from the LIVE/DEAD viability assay. Live cells display green fluorescence, while the dead cells appear red in color. (B) Percentage of cell viability seen at different O2 conditions. Values are presented as mean ± standard deviation (n = 16 views/group; *P < 0.05).
