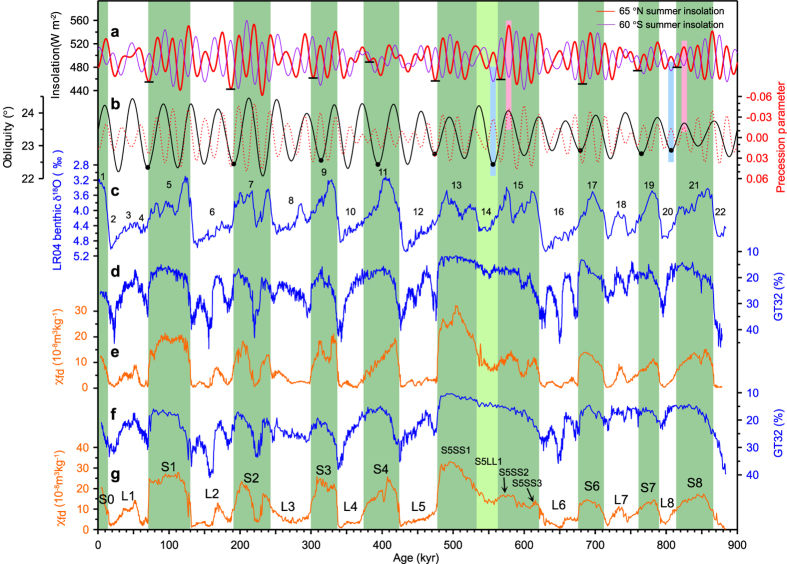
Figure 1. Comparison of the East Asian winter monsoon (EAWM) and summer monsoon (EASM) proxy records in loess with marine and Earth’s orbital records of the last 880 kyr.
a, 21 June insolation 65° N and 21 December insolation 60°S59. Short black horizontal bars mark the insolation minima at 65°N coincident with each glacial inception. b, Earth’s obliquity, and precession parameters59 on a reversed scale. c, Benthic δ18O stack LR0412. Numbers indicate Marine Isotopic Stages. d and e, Grain-size data expressed as GT32 (>32 μm particle content), and frequency-dependent magnetic susceptibility (χfd) in the Yimaguan loess section, respectively. f and g, GT32 and χfd data in the Luochuan loess section, respectively. The major loess and paleosol units are labeled in g. The green shaded bars indicate interglacial MIS stratigraphy, and the light green one highlights the “glacial” MIS 14. The pink bars in a and b indicate late interglacial periods with close alignment of obliquity and boreal precessional insolation maxima, and light blue ones, early glacial periods with close alignment of obliquity and austral precessional insolation minima. The solid circles on the obliquity curve in b indicate the obliquity minima around the glacial inceptions used in the calculation in the Fig. 3. Note the obliquity minima at 314 kyr and 394 kyr are much earlier than the inceptions of MISs 8 and 10.

