Figure 5.

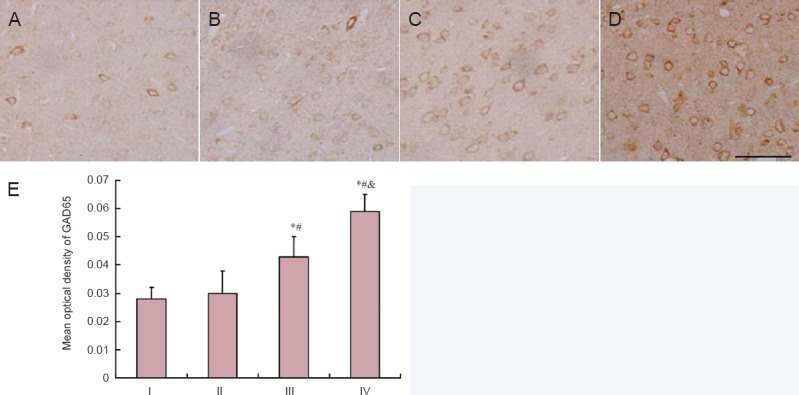
GAD65-immunoreactive neurons in cerebral cortex at 4 weeks after acrylamide treatment.
The images show the immunoreactivity of GAD65 in the cerebral cortex in the control (A), low- (B), moderate- (C), and high-dose acrylamide groups (D). (E) Densitometry of GAD65 immunoreactivity. Data are expressed as the mean ± SD (n = 6). The differences between groups were compared with one-way analysis of variance, followed by Dunnett's post hoc test. *P < 0.05, vs. I (0 mg/kg), #P < 0.05, vs. II (5 mg/kg); &P < 0.05, vs. III (15 mg/kg). GAD65: Glutamic acid decarboxylase 65; I: control group; II: low-dose acrylamide group (5 mg/kg); III: moderate-dose acrylamide group (15 mg/kg); IV: high-dose acrylamide group (30 mg/kg).
