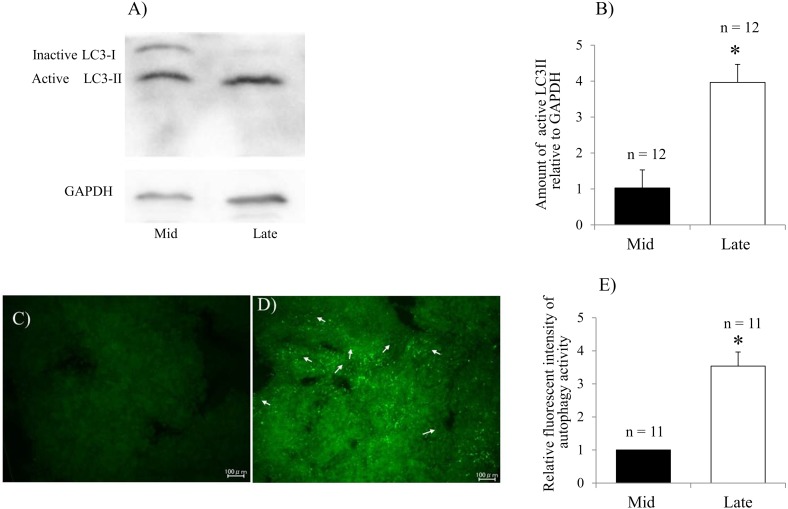
Fig. 2.
Evaluation of LC3 proteins and autophagy activity during bovine CL regression. Expression of the active membrane-bound LC3-II protein and inactive LC3-I protein detected by western blotting analysis (A) and the relative level of active LC3-II protein to GAPDH in the mid and late CL (B). Fluorescence microscopy of the autophagic vacuole accumulation in mid (C) and late (D) CL; Strong and diffuse green signals were observed in the late CL (white arrows). Quantification of autophagy activity was performed by calculating the fluorescence intensity (E). The data are expressed as means ± SEM. *P < 0.05. n, total number of analyzed tissues.

