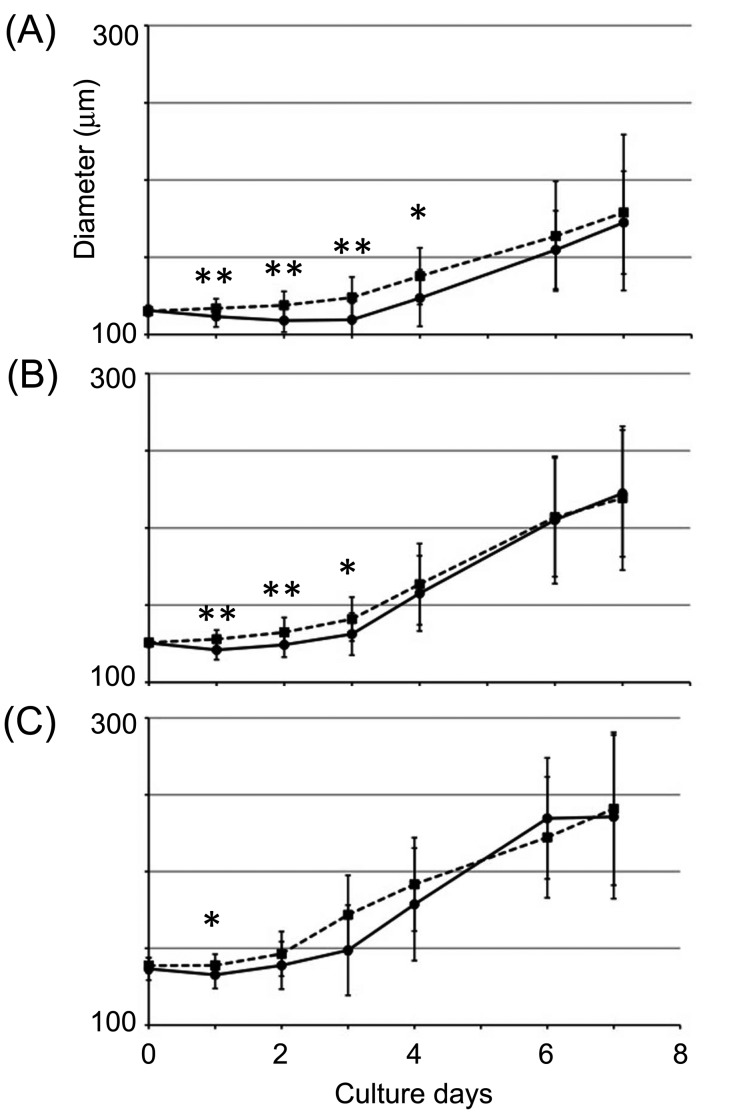
Fig. 6.
Trace of follicle growth of cultured secondary follicles for 1 week. (A) The graph indicates the result of tracing the follicle growth of follicles with a diameter of 110–120 μm. (B) The graph indicates the result of tracing the follicle growth of follicles with a diameter of 120–130 μm. (C) The graph indicates the result of tracing the follicle growth of follicles with a diameter 130 < μm. The black line indicates the follicles cultured in the normal medium (IGF1 (–)), and the dashed line indicates the follicles cultured in the medium containing IGF1 (50 ng/ml, IGF1 (+)).The numbers of samples per experiment were as follows: (A) IGF (–), 20; IGF1 (+), 29; (B) IGF1 (–), 24; IGF (+), 24; (C) IGF1 (–), 18; IGF (+), 15. Statistical significance is indicated by an asterisk (*P < 0.05, ** P < 0.01, *** P < 0.001). Values are presented as means ± standard deviation.

