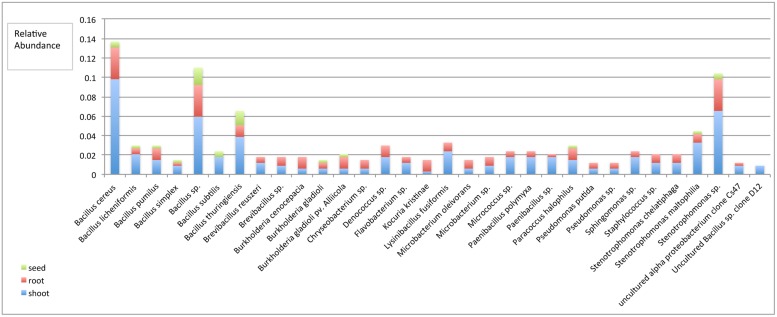
FIGURE 2.
Relative species abundance among plant tissues. The frequency at which an isolated endophyte was counted was based on sequence based classification at the species level, which were organized into a meta-analysis bar chart, revealing the relative abundance of specific species among the three tissues. P < 0.0001.

