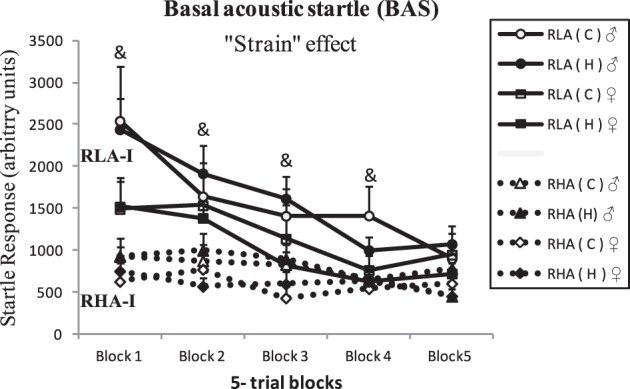
Figure 4.

Mean ± S.E.M of baseline acoustic startle response (BAS, in arbitrary units) across 5-trial blocks (Block1–Block5). &, significant (p < 0.05) “Strain” effects (factorial 2 × 2 × 2 ANOVAs) in these blocks. The overall repeated measures ANOVA also yielded a significant “Strain” effect, as indicated in the figure (p < 0.001, see text for more details). Group symbols: C, control non-handled group; H, neonatally handled (NH) group.
