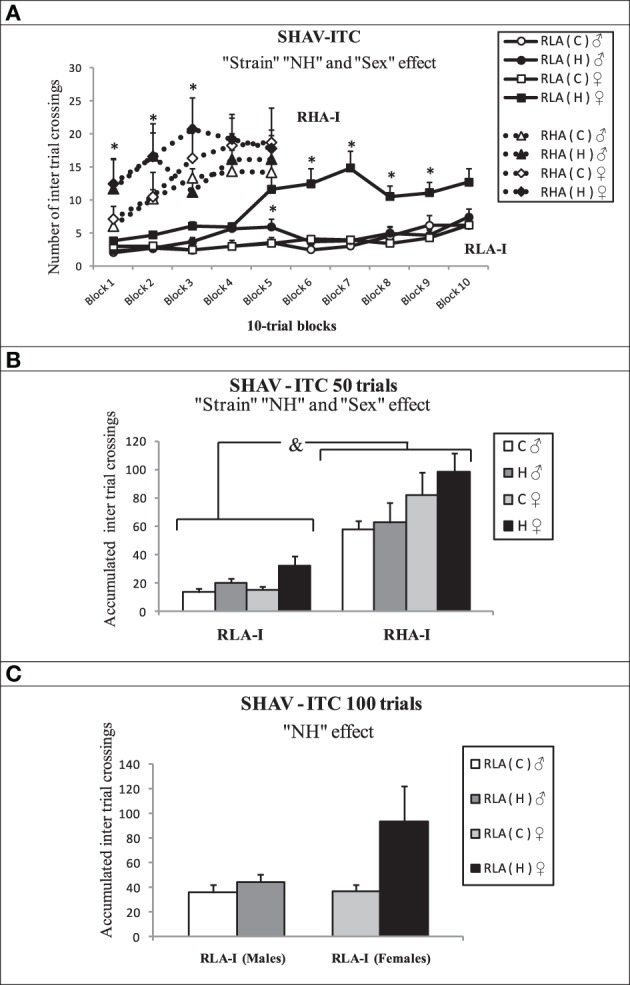
Figure 7.

Mean ± S.E.M. in (A) “Inter trial crossings (ITC)” in RHA-I (50 trials) and RLA-I (100 trials) grouped in blocks of 10 trials each. (B) “Accumulated Inter trial crossings” in the first 50-trial session for both strains; (C) “Accumulated Inter trial crossings” for the RLA-I strain in the total 100 shuttle box acquisition trials. (A) *p < 0.05 vs. the respective control (C) group of the same sex (Duncan's tests after significant ANOVA effects). (B) &, indicates the “Strain” effect (see text for significance); *p < 0.05 between the groups indicated (Duncan's tests following significant ANOVA effects). Group symbols: C, control non-handled group; H, neonatally handled (NH) group.
