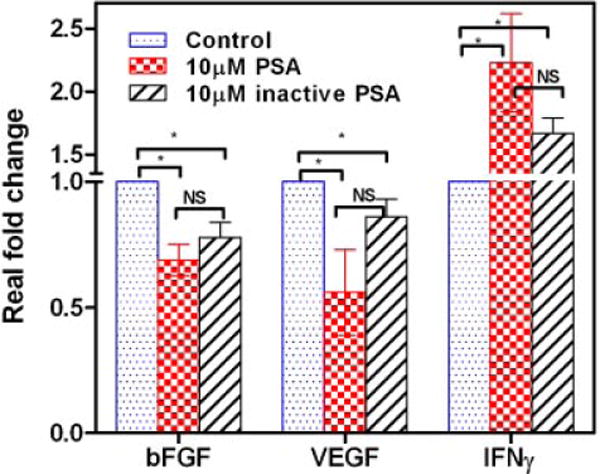
Fig. 5.

Gene expression levels of bFGF, VEGF, and IFN-γ in HUVEC treated with enzymatically active and inactive f-PSA. Nearly confluent monolayers were treated with10 μM f-PSA; RNA was extracted and reverse transcribed. The c-DNA was amplified by real-time QPCR using specific primers. The results shown are average of three experiments.
