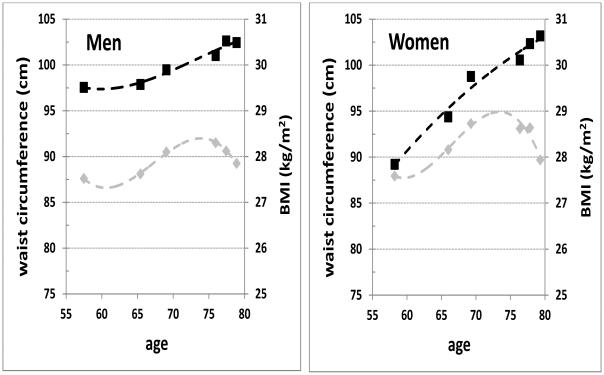
Figure 1.
Longitudinal change in waist circumference (black squares) and body mass index (BMI: grey diamonds), by sex, from the San Antonio Heart Study baseline exam through the third San Antonio Longitudinal Study of Aging (SALSA) follow-up, for SALSA participants who returned to this last exam. Dashed trend lines represent third-order polynomial fits to the data points.

