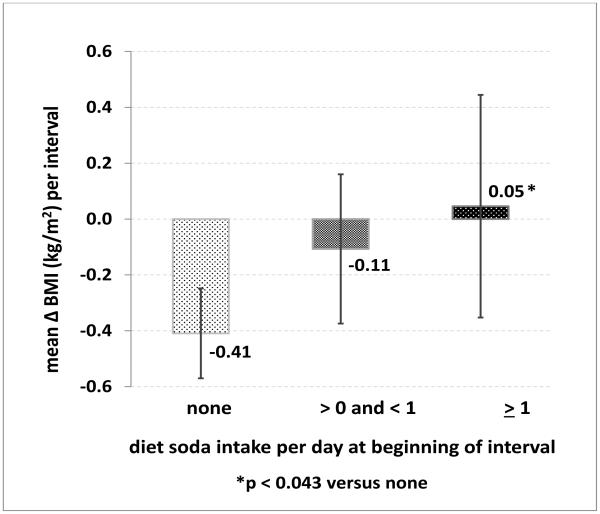
Figure 2.
Mean change in body mass index (kg/m2 (95% confidence interval)) per follow-up interval, by diet soda consumption category at the beginning of the interval, adjusted for sex, age, ethnicity, education, neighborhood, beginning body mass index, leisure physical activity level, diabetes, smoking status, and length of interval.

