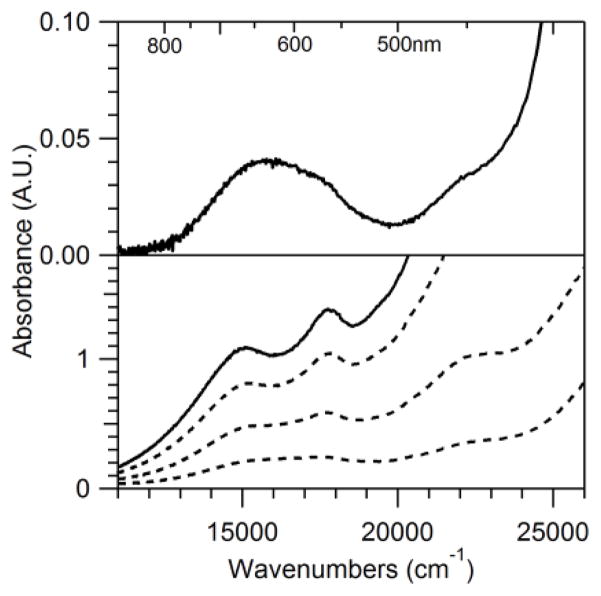
Figure 3.
Electronic absorption spectra showing the reaction of a 7.5 mM acetonitrile solution of 1 with 50 equiv. anhydrous H2O2-urea at −18 °C. The solution was filtered into a pre-cooled cuvette (−20 °C) prior to collecting the first absorption spectrum (top). After four hours at −20 °C, the final absorption spectrum was obtained (bottom; solid line).

