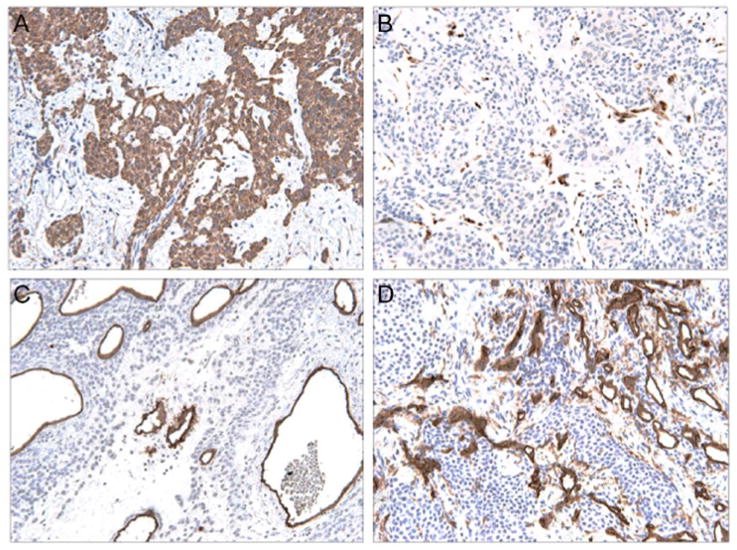
Figure 4. Typical immunohistochemical profile of glomus tumor.

(A) αSMA immunostaining (200×), highlights diffuse staining of lesional cells. (B) S100 immunostaining, highlighting rare dendritic cells only (200×). (C) CD34 immunostaining, which predominantly highlights vessels (200×). (D) Lack of CD31 immunoreactivity, which highlights vessels only (200×).
