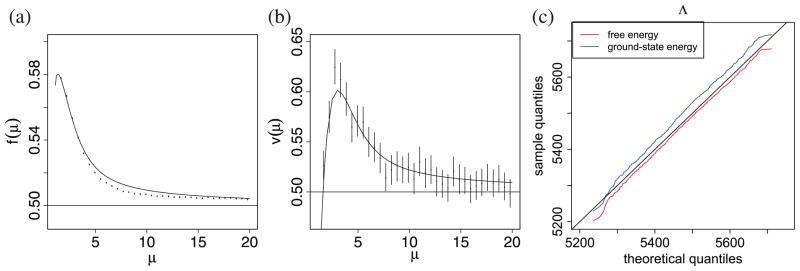
Figure 2.

Comparison of asymptotic theory to finite-n simulations. We generated networks from the stochastic block model with varying average degree μ (n = 104, k = 2, γ1 = γ2 = 1/2, ω11 = ω22, and ω12/ω11 = ω21/ω22 = 0.15) and computed Λ (the log-likelihood ratio) for each graph. Parts (a) and (b) show n−1E(Λ) and n−1var(Λ), comparing 95% bootstrap confidence intervals (over 103 replicates) to the asymptotic formulas (respectively f(μ) from (15) and v(μ) from (17)). Part (c) compares the distribution of Λ from 104 replicates, all with μ = 3, to a Gaussian with the theoretical mean and variance.
