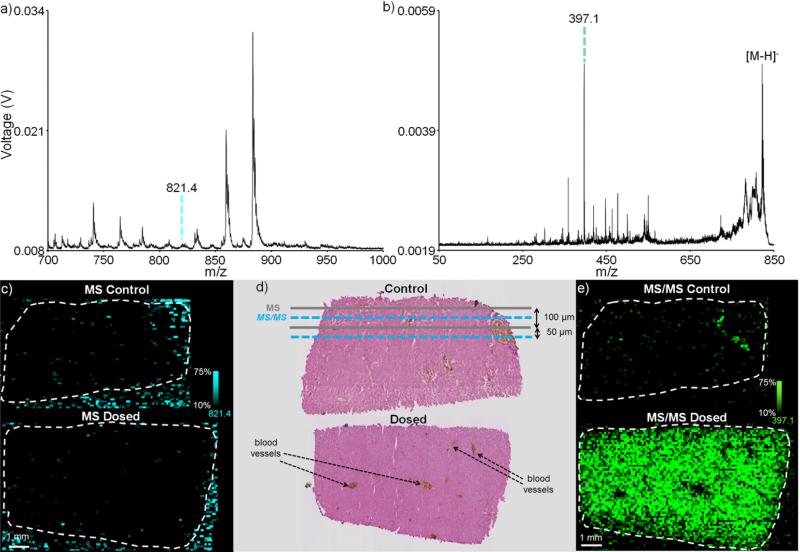
Figure 4.
IMS of liver dosed in vivo: Average spectra for (a) MS analysis and (b) MS/MS analysis of the [M-H]− of rifampicin from the dosed liver (each spectrum is an average of a 100 pixel region of interest). (c) A 14,387 pixel MS mode image acquired in 35 minutes shows no rifampicin localization as the drug signal is overwhelmed by the chemical background (blue). (d) Hematoxylin and eosin (H&E) stains of serial liver sections are used to indicate the manner by which the interleaved MS and MS/MS scans are performed. (e) The improvement in signal-to- noise afforded by the MS/MS mode image (13,822 pixels acquired in 49 minutes) allows for the detection of the primary fragment of rifampicin (821.4 → 397.1) and provides an image of drug distribution. All ion images are plotted using a ±0.4 m/z tolerance. Due to the difference in experimental modes (MS and MS/MS), ion (and image) intensities are not comparable between a (c) and b (e).

