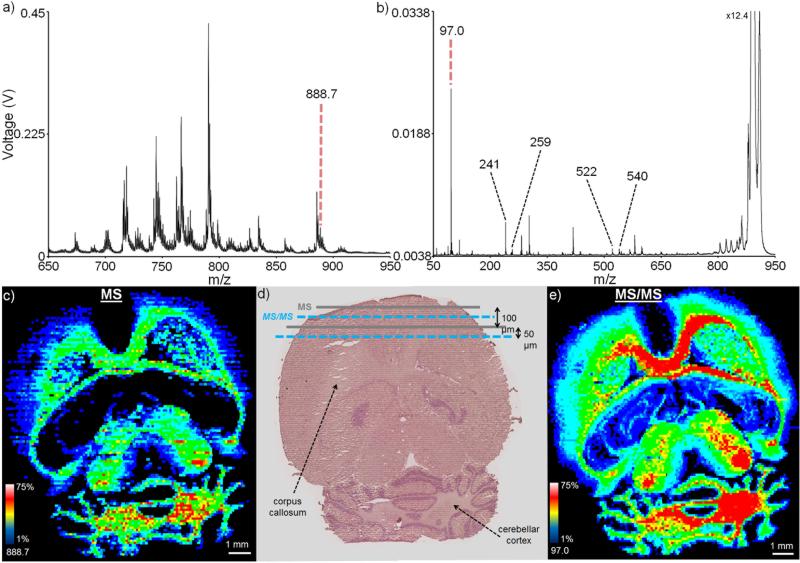
Figure 5.
Mouse brain imaging: Average spectra for (a) MS analysis and (b) MS/MS analysis of the m/z 888.7 (each spectrum is an average of a 100 pixel region of interest). (c) A 17,346 pixel MS mode image acquired in 43 minutes shows the m/z 888.7 lipid to localize to specific regions of the brain, including the corpus callosum and cerebellar cortex. (d) H&E stain of a serial brain section following IMS shows the interleaved MS and MS/MS analyses. (e) A 16,904 pixel MS/MS mode image acquired in 22 minutes showing bisulfate fragment ion (888.7 → 97.0) confirms the parent m/z 888.7 lipid localization. Using other fragment ions, the lipid of interest can be identified as SM4s(d18:1/24:1). All ion images are plotted using a ±0.4 m/z tolerance. Due to the difference in experimental modes (MS and MS/MS), ion (and image) intensities are not comparable between a (c) and b (e).

