
Fig. 4.
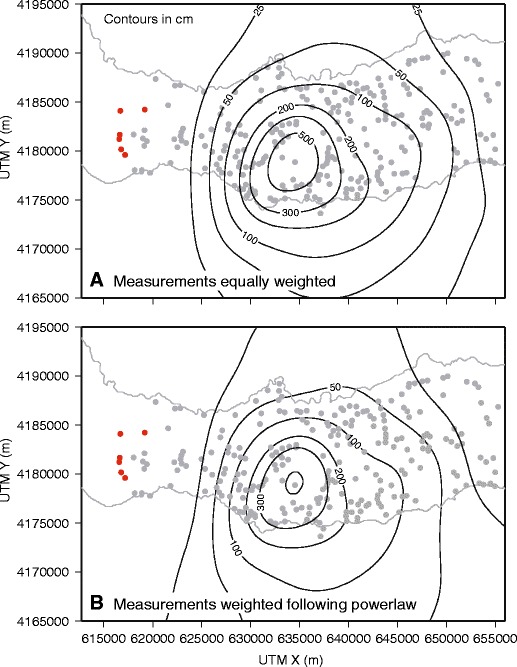
Isopach maps produced by applying a cubic B-spline model to the Fogo member A dataset (contours in cm; red markers represent locations where ash not observed). a Contours produced when all data points are equally weighted. b Contours obtained when data points are weighted according to measurement uncertainty (see text for details)