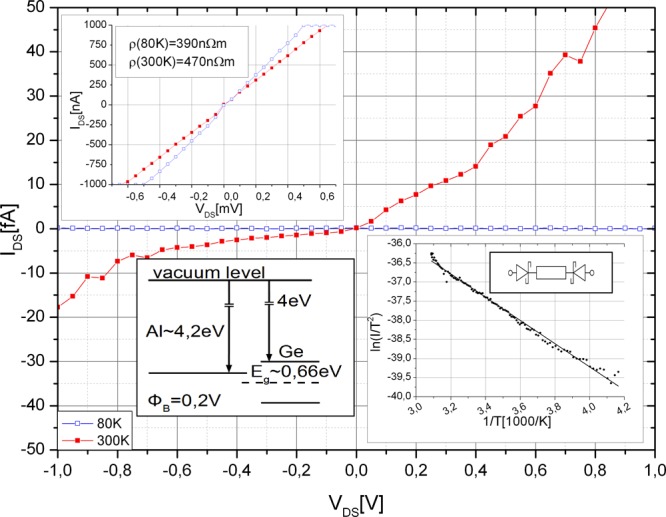
Figure 3.

I–V characteristic of the Al/Ge/Al NW heterostructure (main plot) and fully exchanged Al NW (upper left inset) measured at RT (red line) and 80 K (blue line), respectively. The lower left inset shows the band relation between Al and intrinsic Ge. The lower right inset shows the activation energy plot ln(I/T2) as a function of inverse temperature for an individual Al/Ge/Al NW heterostructure and the respective model of the circuit diagram.
