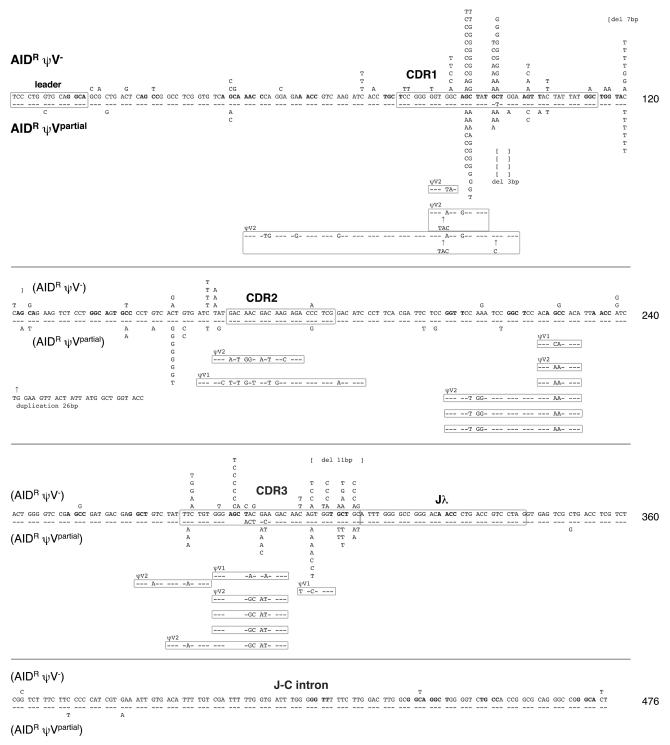
Figure 3. Ig Light Chain Sequence Analysis of the ψV Knockout Clones.
Mutation profiles of the AIDRψV– and AIDRψVpartial clones. All differences identified in different sequences in the region from the leader sequence to the J-C intron are mapped onto the rearranged light chain sequence present in the AIDR precursor clone. Mutations of the AIDRψV– and AIDRψVpartial clones are shown above and below the reference sequence, respectively. Deletions, insertions, and gene conversion events are also indicated. Hotspot motifs (RGYW and its complement WRCY) are highlighted by bold letters. Changes displayed in the same horizontal line are not necessarily derived from the same sequence.

