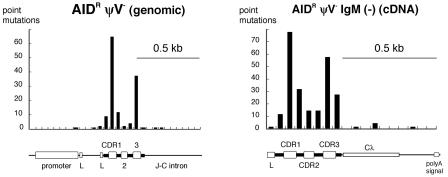
Figure 5. Mutations within Unsorted and Sorted sIgM(–) cells.
Distribution of nucleotide substitutions within genomic sequences from unsorted AIDRψV– cells and within cDNA sequences from sorted IgM(–) AIDRψV– cells. The numbers of mutations are counted for every 50 bp, and are shown together with the corresponding physical maps of the light chain genomic locus or the cDNA sequence.

