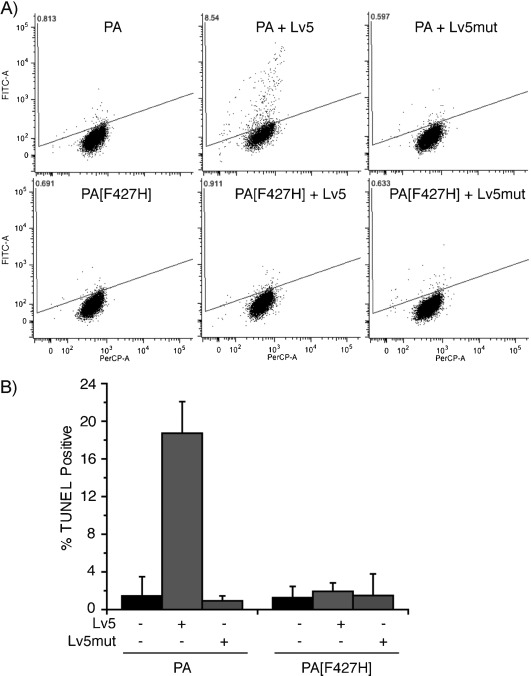
Figure 5.

Monitoring of apoptosis of K562 cells treated with Lv5 and PA by the TUNEL assay. A) K562 cells treated with the indicated analogues (500 nm Lv5 or Lv5mut in the presence of 80 nm PA or PA[F427H]) for three days and analyzed for apoptosis; 1 μm imatinib served as a positive control. Representative dot plots from flow cytometry show terminal deoxynucleotidyl transferase (TdT) catalyzed BrdUTP incorporation into the DNA strand breaks of apoptotic cells; this is detected by Alexa Fluor 488-labeled anti-BrdU antibody (FITC). PerCP indicates the DNA fraction. B) Quantification of TUNEL-positive cells: intensities normalized to K562 cells treated with imatinib (100 %) and non-treated cells (0 %). The dot-plots of imatinib-treated and untreated cells are shown in Figure S10. Data are averages of three independent experiments.
