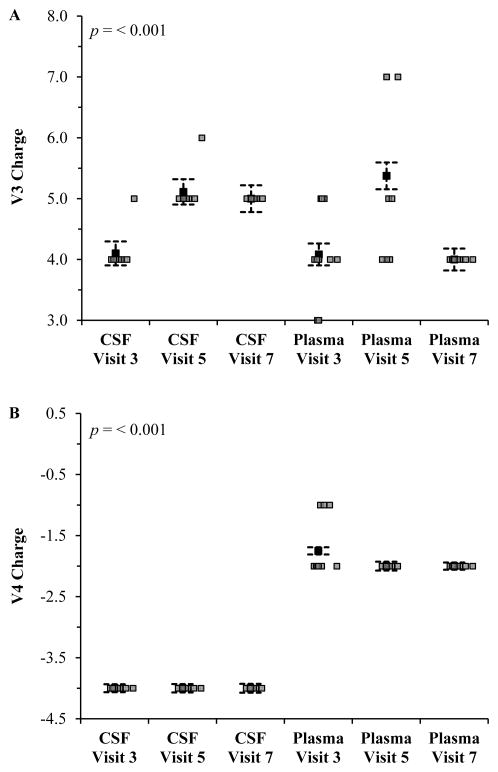
Figure 2. The V3 and V4 net charges significantly differed between CSF and plasma isolates during the course of asymptomatic disease and cART.
The net charges of the gp120 regions V3 and V4 were calculated by subtracting the number of negatively charged amino acids from the number of positively charged amino acids. Error bars indicate the mean standard error. Statistical comparisons were done using single factor analysis of variance (ANOVA) followed by Tukey’s test (post hoc). Values of p<0.05 were considered to be statistically significant.

