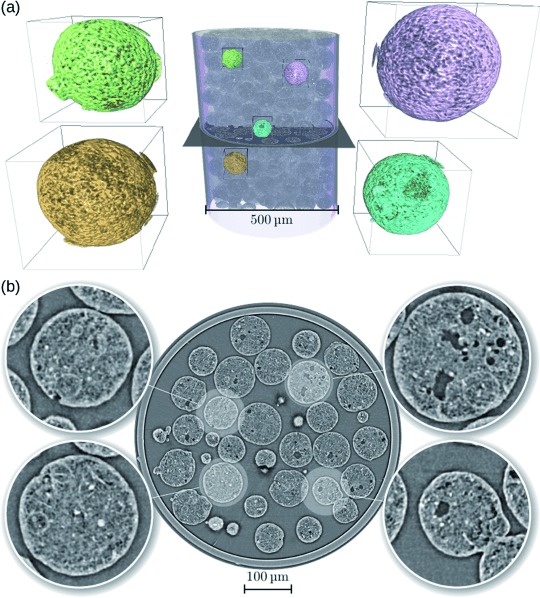
Figure 1.

Phase-contrast X-ray microtomography results from the experiment with the FCC catalyst body. a) 3 D rendering of the catalyst bodies inside the capillary. Four selected regions of interest of approximately 91×91×91 μm3 each are marked with different colors and are shown magnified (5×) adjacent to the tomographic volume. b) One axial slice in the middle (shown in (a) for reference) of the phase-contrast tomogram of the sample. Insets show zoomed-in images (3× magnification) of four selected catalyst bodies.
