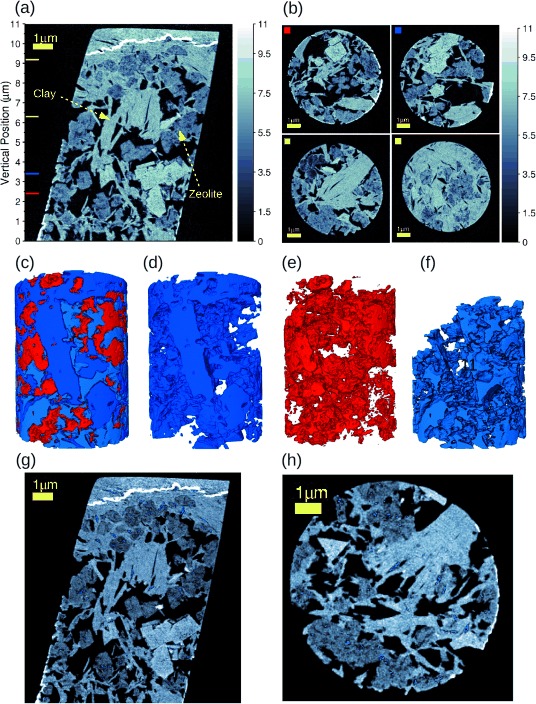
Figure 2.

Ptychographic X-ray nanotomography results from the experiment with the FCC catalyst body. a) Vertical section from the middle of the electron-density tomogram. The 5 % La2O3-exchanged zeolite type Y and metakaolin clay, identified based on their different electron density, are indicated. The vertical-position axis can be correlated to the one in Figure 3 b. b) Some selected axial sections of the phase-contrast tomogram. The colored squares at the top-left corner correspond to the positions of the colored lines in (a). In (a) and (b), the gray intensity of the images is given in units of electron density (×1023 electrons per cm3). c) 3 D rendering of the pores in light blue, the zeolite type Y in blue, and the metakaolin clay in red. (d–f) The renderings as in (c), but separated by component for better visualization of how the components are located to each other. g, h) Two orthogonal sections from the middle of the tomogram, some enclosed pores are shown in blue. Scale bars=1 μm.
