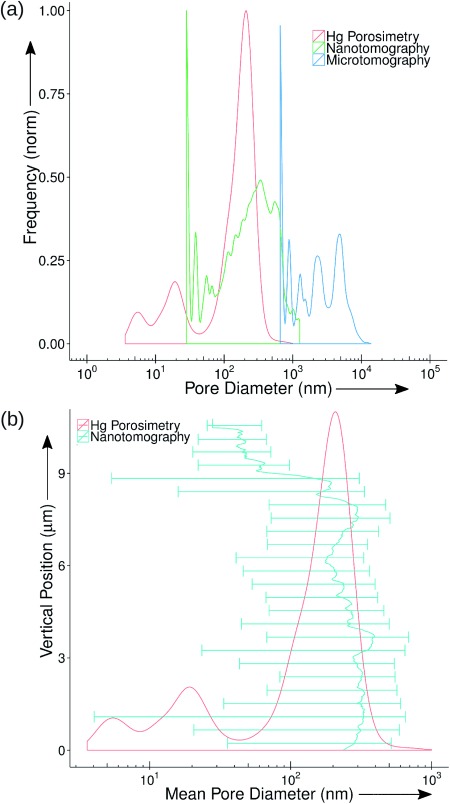
Figure 3.

Pore-size analysis of FCC Catalyst body. a) Pore-size distributions (PSD) as a function of the pore diameter. The mercury PSD is shown in red. The pore-size distributions extracted from the 3 D images obtained with X-ray imaging techniques are displayed in blue for the phase-contrast microtomography and in green for the ptychographic nanotomography. b) The variation of the mean value (solid line) and size-distribution range (bars) of the pore diameter plotted against vertical position calculated for 25 evenly divided bins of the tomogram from the bottom to the top. The vertical-position axis can be correlated to the one in Figure 2 a. The mercury PSD is shown in red for reference.
