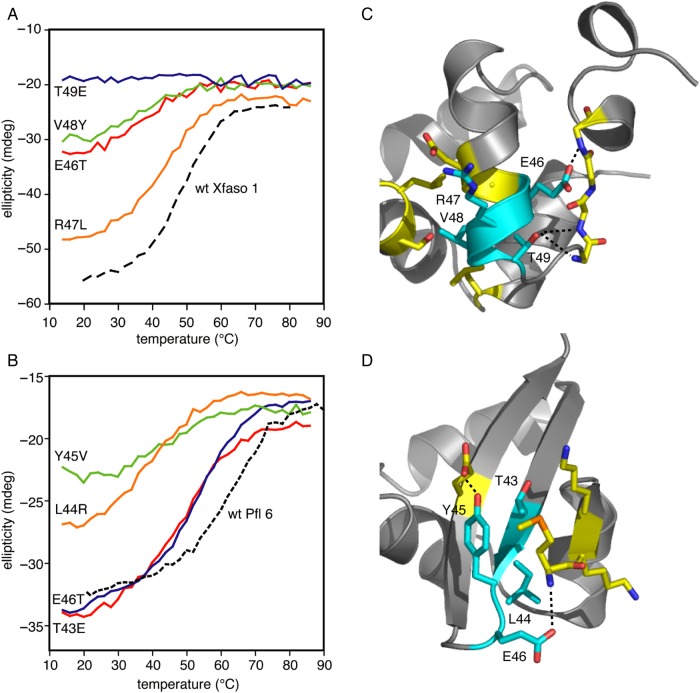
Fig. 6.
Single hybrid substitutions exchanging aligned residues in the most critical region of the C-terminal sequence. (A) thermal denaturation curves of Xfaso 1 variants monitored by CD at 222 nm (25 μM protein at 1 mm pathlength, 20°C), (B) thermal denaturation curves of Pfl 6 variants, (C) interactions made between residues in this region in the Xfaso 1 structure (cyan) and other side chain or backbone groups (yellow), with hydrogen bonds shown as dashed lines, (D) equivalent analysis for this region of Pfl 6.

