
Fig. 2.
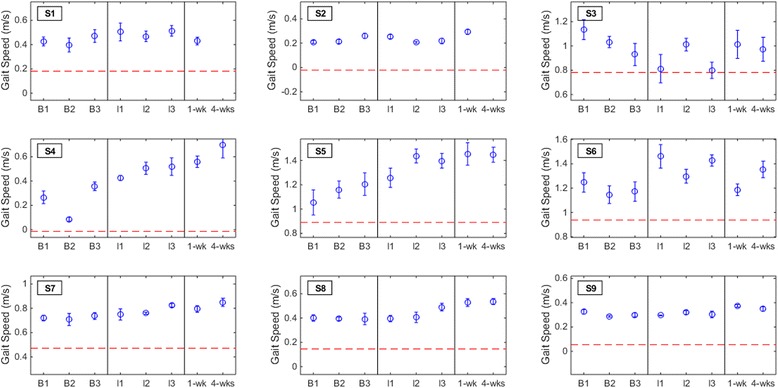
Gait speed measurements for each subject. The results from the baseline (B1, B2, and B3), interval (I1, I2, and I3), and post-therapy (one week and four weeks) gait speed assessments are shown for all subjects. The error bars shown here represent the within-assessment standard deviation (gait speed measurements were repeated five times per assessment), while the blue circles represent the within-assessment means. Note that the error bars are only displayed here to provide insight into the within-assessment standard deviation, and only the means for each assessment [29] were used in the outcome measures and post-hoc analyses. The red dashed line denotes the threshold of clinically important deterioration (0.16 m/s decrease from average baseline)