
Fig. 4.
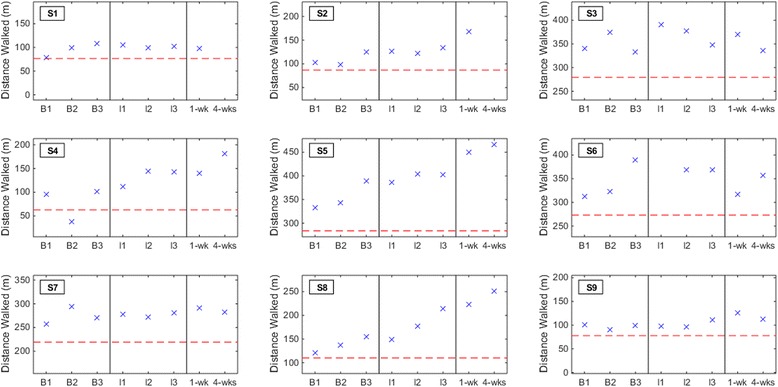
Subjects’ six minute walking distance (6MWD) at each baseline (B1, B2, and B3), interval (I1, I2, and I3), and post-therapy (one week and four weeks) assessment. The red dashed line denotes the threshold of clinically important deterioration (20 % decrease from average baseline)