
Fig. 6.
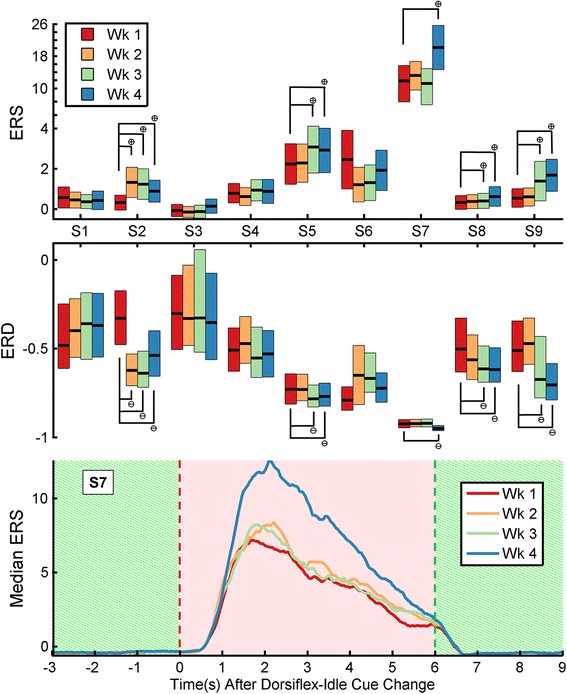
Top and Middle: Event-related synchronization (ERS) and desynchronization (ERD) during each week for all subjects. ERS, top, and ERD, middle, during weeks one through four (wk 1–4, or sessions 1–3, 4–6, 7–9, 10–12, respectively). Boxes signify intervals of one median absolute deviation around the median (central black bar). Significant positive and negative changes from week one are denoted by a cross-in-circle symbol and a line-in-circle symbol, respectively. Bottom: Temporal profile of median ERS during weeks one through four, taken from S7. The cue being presented is denoted by the background (“Dorsiflex”, hatched green; “Relax”, solid red)