
FIGURE 4.
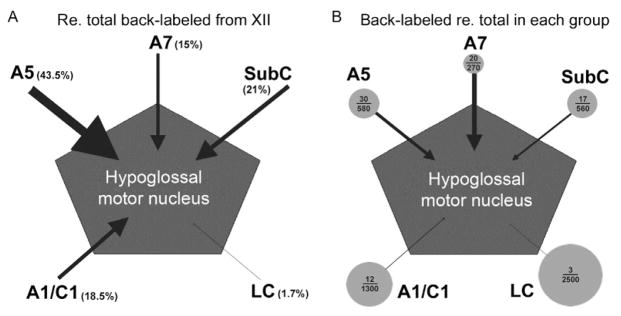
Quantitative representation of afferent projections to the XII nucleus from distinct groups of pontomedullary noradrenergic (NA) neuronal groups. (A) When expressed relative to the average total numbers of retrogradely labeled NA neurons following tracer injections into the XII nucleus, cells of the A5 group have strongest projections, followed by sub-coeruleus (SubC), A1/C1 and A7 groups, whereas the projections from the locus coeruleus (LC) are negligible. (B) When the numbers of NA cells retrogradely labeled from the XII nucleus are expressed relative to the average total numbers of neurons present in each cell group, the A7 group contains the highest percentage of cells that send axons to the XII nucleus. In this panel, circles are scaled proportionally to the square root of the numbers of cells counted bilaterally in each NA group and arrow thickness is proportional to the percentage of cells in each group that were retrogradely labeled from the XII nucleus. The numbers inside each circle represent the average numbers of retrogradely labeled cells found in each group per animal and the average total numbers of NA cells in each group, as determined by Rukhadze and Kubin (2007). Consistent with the representation of axonal projections to the XII nucleus shown in (B), pharmacological inhibition of A7 neurons resulted in a significant reduction of spontaneous XII nerve activity (Fenik et al., 2008), whereas local microinjections of clonidine to inhibit A5 or SubC neurons did not result in significant changes (Fenik et al., 2002, 2008).