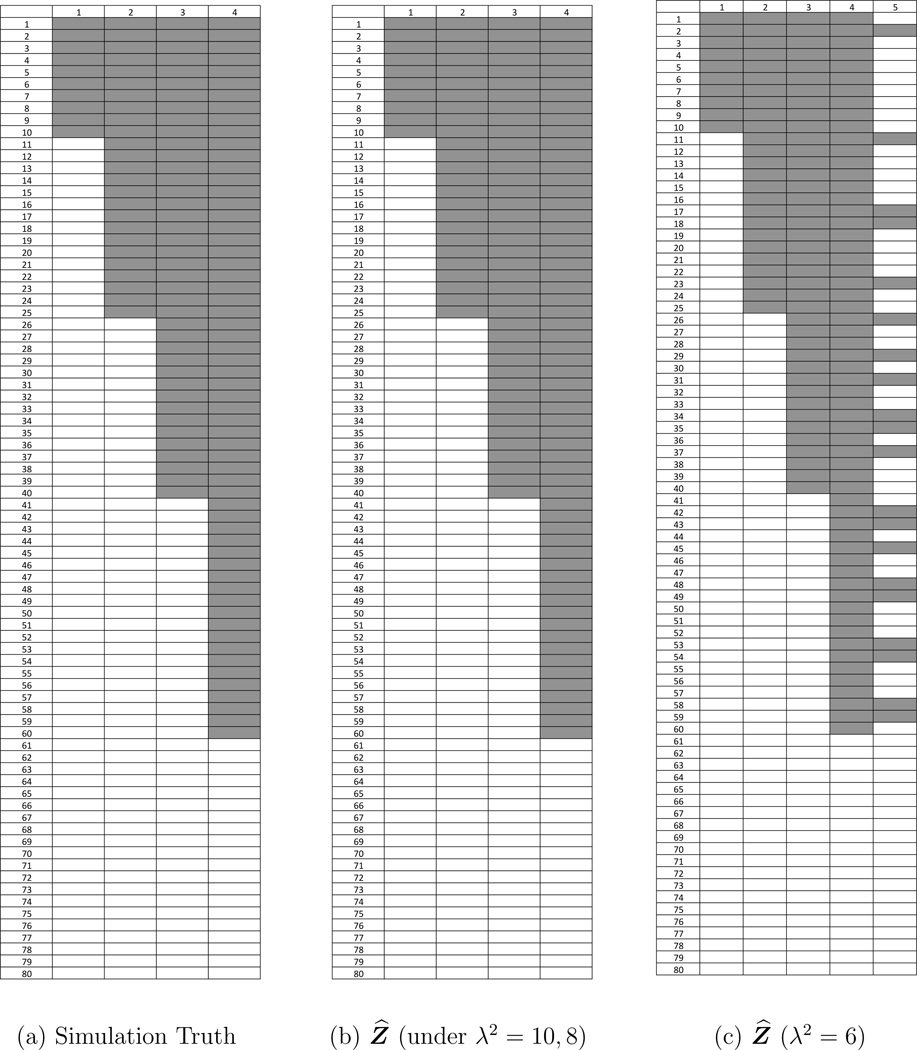
Figure 3.
A simulation example. The plots show the feature allocation matrix Z, with shaded area indicating zsc = 1, i.e., variant genotype. Rows are the SNVs and columns are the inferred haplotypes. Panel (a) shows the simulation truth Zo. Panel (b) displays the estimated feature allocation matrix Ẑ for λ2 = 8 and 10. The estimate perfectly recovers the simulation truth. Panel (c) shows b Ẑ for λ2 = 6. The first four haplotypes match the simulation truth.

